

A goal, a heatwave or a market swing gets people’s attention. Proving that it also moved the business takes a different kind of measurement.
The match ended an hour ago. The goal moment fired across feeds, CTV and push within a second of the ball hitting the net, and engagement went through the roof. On Monday someone in the finance review asks a fair question:
“Would those people have bought anyway?”
If the honest answer is “we don’t know”, the moment becomes a nice story instead of a budget line. And next year, the budget goes back to the flight that’s easier to explain.
Moments marketing has a measurement problem, but it isn’t the one people expect. Moments are actually easier to measure properly than most activations. They just need to be measured differently.
Measurement is under pressure everywhere
Marketing budgets aren’t growing. Gartner’s 2025 CMO Spend Survey of 402 marketing leaders found budgets flat at 7.7% of company revenue, with 59% of CMOs saying that isn’t enough to deliver their strategy. When money is tight, every line gets questioned.
Confidence in the numbers isn’t keeping up either. In a 2025 study by EMARKETER and TransUnion, 60% of US marketers said internal stakeholders question their metrics at least some of the time. Nearly 29% said up to 20% of their budget had been moved or put at risk because of doubts about measurement. Incremental ROI was the top priority, named by 67%.
So the bar isn’t “did people engage?” It’s “what happened that wouldn’t have happened otherwise?”
Why moments get measured badly
Vanity first. A moment drives a burst of engagement, so engagement becomes the headline. It’s the easiest number to pull and the hardest to connect to revenue.
No baseline. If the moment creative is the only thing running, there’s nothing to compare it with. You know what happened, but not what would have happened.
Moments are short. A goal moment lasts minutes. Standard reporting runs by day or by week, so the moment gets blended into everything else.
Channels report separately. Meta, TikTok, CTV, programmatic and push each report their own slice. Nobody adds up a single moment across all of them.
Moments come with a control group built in
This is the part most teams miss. A rule-based moment almost always runs next to its own counterfactual:
- When no signal is firing, the default creative runs to the same audience, on the same channels, with the same budget logic.
- When a signal falls inside the threshold, the rule pauses, so there’s a natural “off” period.
- Signals like weather fire in some cities and not others at the same moment.
Each of these is a comparison you get for free. You don’t need to invent a test. You need to keep the data.
Five ways to measure a moment
1. Moment vs default
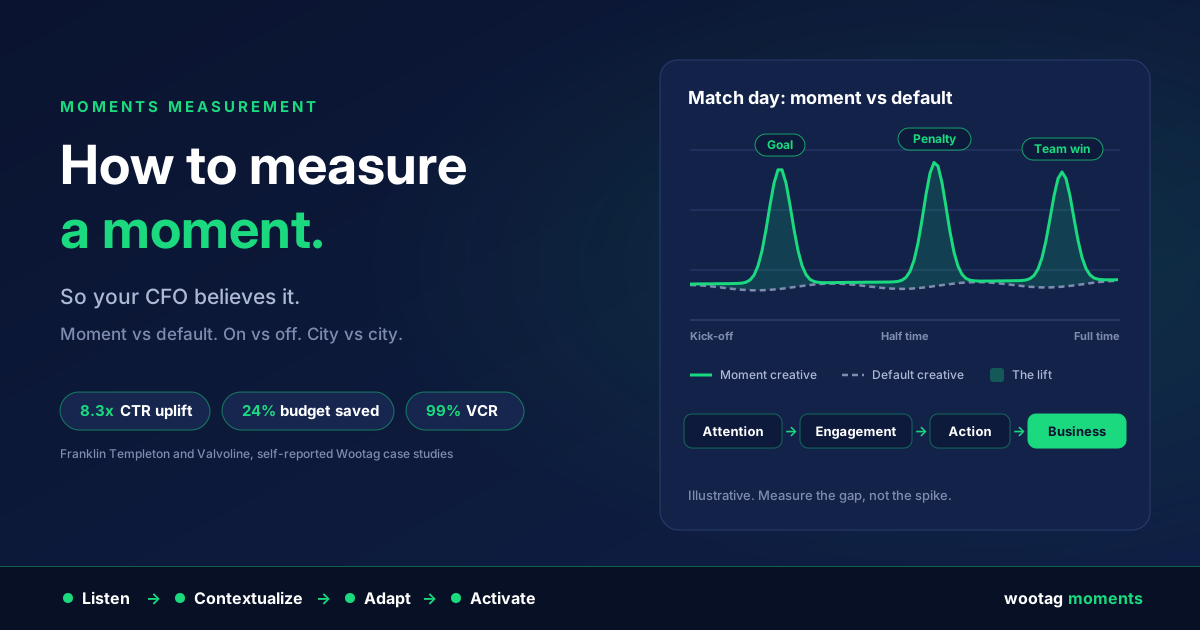
Compare performance when a moment is live against the default creative running in the same channels to the same audience. This is the cleanest everyday read, and it’s the one most moment results should be built on. A higher click-through rate during a goal moment means little on its own. A higher click-through rate than the default creative running in the same match tells you the moment did something.
2. On vs off windows
Rules that pause when nothing meaningful is happening give you a ready-made holdout. Franklin Templeton’s index-based activation is the clearest example. A rise of 0.3% or more served a growth film, a fall of 0.3% or more served a stability film, and anything in between paused. Wootag reports that this delivered an 8.3x lift in click-through rate and a 24% budget saving, with no impressions wasted in the flat periods.
3. Geo split
Weather, air quality and local stock signals don’t fire everywhere at once. When a heatwave rule fires in one city and not in a similar city nearby, the difference in store visits, orders or search interest between the two is a strong read on what the moment added. For bigger decisions, you can deliberately hold one market back.
4. Moment by moment
Don’t report “the World Cup”. Report each moment inside it. When Valvoline ran live FIFA moments on CTV, the results were broken down across Goal, Halftime, Penalty and Team Win, and Penalty came out as the top-performing moment. That kind of breakdown tells you which rules to keep, which to change and which to drop before the next tournament.
5. Tie the moment to a business number
Engagement shows attention. To show business impact, connect each moment to the closest commercial metric you can see. That might be orders, basket size, store visits, app installs, sign-ups or qualified leads. For brands that share inside signals like POS or inventory data, sell-through by store during a moment is about as direct as measurement gets. For B2B, the equivalent is pipeline influenced by the moment.
Build a metric ladder, not one number
Different people need different answers. A simple ladder keeps everyone on the same page:
| Level | What it tells you | Example metrics |
|---|---|---|
| Attention | Did the moment get noticed? | Video completion rate, viewability, reach during the window |
| Engagement | Did it land better than the default? | CTR, engagement rate, interaction rate vs default creative |
| Action | Did people do something? | Site visits, add to cart, app opens, lead form completions, store locator use |
| Business | Did it move a number finance cares about? | Orders, sell-through, revenue per moment, cost per acquisition, pipeline |
| Efficiency | Did it use budget better? | Cost per result vs default, budget saved by paused rules |
Every Wootag case study reports at least two levels of this ladder. Valvoline’s CTV moments reached a 99.03% average video completion rate with 37% better cost efficiency. Budweiser’s FIFA display moments delivered a 3.2x engagement uplift and 39% cost efficiency. Everyuth’s weather moments on Meta delivered a 2.3x engagement uplift and 41% cost efficiency.
A simple setup before your next moment goes live
- Write the question first. For example: “Do goal moments drive more orders than the default creative during the same match?”
- Keep a default running. Don’t pause everything outside the moments. The default is your baseline.
- Log every trigger. Each moment needs a timestamp, a location and the rule that fired, so results can be lined up against it.
- Pick one business metric per vertical and agree it with finance before launch, not after.
- Report by moment, not by month. A monthly average hides exactly what you’re trying to learn.
- Count the savings. Budget not spent during paused periods is a result, so report it.
The same measurement works across channels
Measurement shouldn’t depend on which platform the moment ran on. The same rule fires on Meta, TikTok, CTV, programmatic, push and retail screens, so the trigger log becomes the common thread that ties channel reports together. Your attribution tools, MMM and lift studies stay as they are. The moment log gives them a clear, time-stamped event to measure against.
Where to start by vertical
| Vertical | Moment | Easiest comparison | Business metric |
|---|---|---|---|
| FMCG and beverages | Goal, team win, heatwave | Moment vs default in the same match or day | Quick commerce orders, retailer sell-through |
| Personal and home care | Temperature, humidity, AQI | Geo split between cities | Product page visits, marketplace orders |
| Fintech and wealth | Index move past a threshold | On vs off windows | App opens, account sign-ups, SIP starts |
| QSR and food delivery | Match night, rain | Moment vs default by zone | Orders per hour, average order value |
| Retail and apparel | Weather plus local stock | Geo split, store by store | Sell-through, store visits, click and collect |
| Automotive | Race moments, fuel price moves | Moment by moment breakdown | Service bookings, dealer enquiries |
| B2B and enterprise | Sponsorship results, market moves | Moment vs default on LinkedIn | Lead form completions, meetings, pipeline |
Measure the moment you’re about to run
The best time to set up measurement is before the signal fires, not after the match ends.
Tell us the moment you’re planning and the number your finance team cares about, and we’ll show you a live moment built on your brand in 20 minutes, along with how we’d measure it.
