
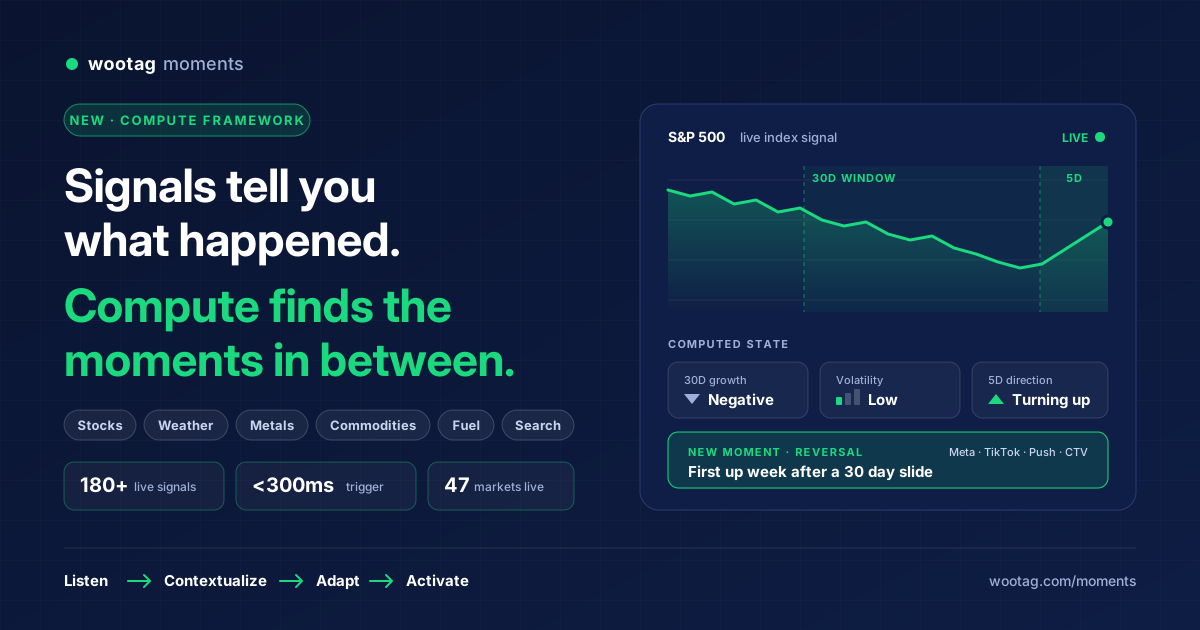

The S&P 500 closes up 0.8% today. Is that a moment?
It depends. If the index has climbed for nine straight sessions, today is the tail end of a rally and your audience already feels confident. If it fell 6% over the last month and today is the first green day in weeks, the same 0.8% means relief. If it swung 2% in both directions before closing up, the number on the screen hides a day of nerves.
One data point. Three very different states of mind. Three very different things a brand should say.
This is the problem we set out to solve with the new compute framework on Wootag Moments. The platform has always listened to live signals and turned them into moments. Now it also does the math on those signals, across time windows and thresholds. That math does more than sharpen the moments you already run. It uncovers new ones: moments that live in the space between readings, which no single data point could ever trigger.
A signal is a reading. A moment is an interpretation.
Most real-time marketing today runs on what we call single-reading logic. A value crosses a line, a rule fires, a creative goes out. Temperature above 35°C, show the cold drink. Index up, show the growth message.
That logic got the industry a long way. It is also where most activations quietly lose relevance. A single reading tells you where something is right now. It tells you nothing about where it came from, how fast it is moving, or whether today is normal or unusual.
People do not react to readings. They react to change. A 32°C day in a city that has sat at 24°C all week feels like a heatwave. The same 32°C in the middle of summer feels like Tuesday. Gold at a record high after a slow climb is a story about safety. Gold at the same price after a sharp two day spike is a story about fear.
If the platform only sees the reading, the brand only gets half the moment.
Why most stacks stop at the reading
The gap is not a lack of data. Market feeds, weather APIs and commodity prices are everywhere. The gap is that nobody owns the step between the feed and the message.
- Data teams can model trends and volatility, but their output lands in a dashboard, not in an activation.
- Marketing teams can write five versions of a message, but they cannot hand code a rolling 30 day growth rate into a campaign rule.
- Ad platforms and CEPs are built to deliver a creative quickly. They are not built to decide which creative a market condition calls for.
So the work falls back to the simplest possible rule, or to a person watching a ticker and swapping assets by hand. Neither scales across 47 markets and 180+ live feeds. And neither can react in under a second when the condition finally lines up.
The result is predictable. Brands either over fire on noise or miss the moments that actually move people.
What the compute framework does
The compute framework is a layer that sits on top of every live signal Wootag Moments ingests. Before a signal becomes a moment, compute asks three questions of it: how much has it moved, over what window, and how steady was the ride.
Take the S&P 500. The raw signal is the index level, refreshed through the trading day. Compute turns that one stream into a set of derived indicators:
- Growth over durations. Percentage change across the windows you choose, such as intraday, 5 days, 30 days or year to date. A brand can ask for the 30 day trend, not just today’s close.
- Direction. Each window resolves to a positive or negative growth indicator, with a neutral band in between so small wiggles do not fire anything.
- Volatility. How far the index swung inside the window. A calm climb and a choppy climb end at the same number but call for very different words.
- Combinations. Indicators can be read together. Positive 30 day growth with high volatility is a different moment from positive growth with low volatility.
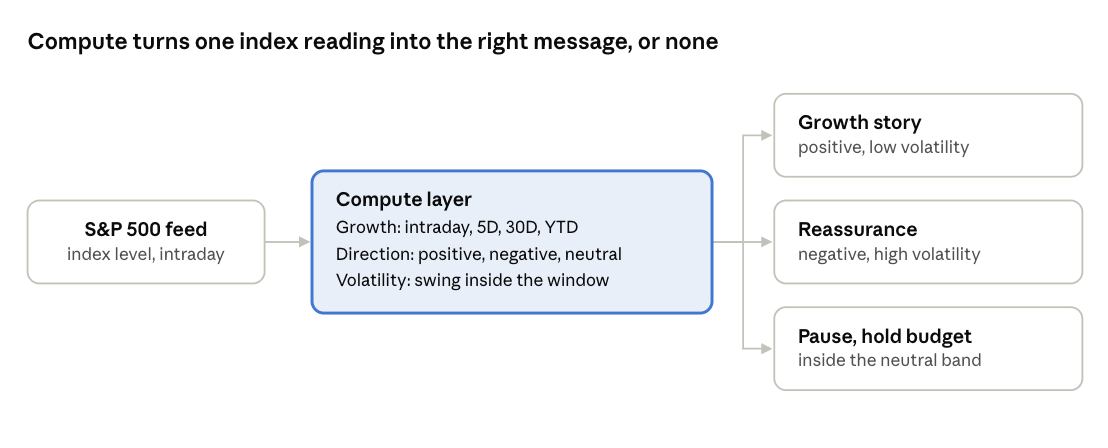
One feed goes in. Compute reads it across windows and volatility, and only a qualifying state reaches the audience.
Each combination maps to a message the brand has already approved. Here is how that might look for a wealth or fintech brand:
| Computed state | What the audience is feeling | Message direction |
|---|---|---|
| Positive growth, low volatility | Confident, maybe complacent | Growth story, start or top up a monthly plan |
| Positive growth, high volatility | Excited but nervous | Ride the upside with discipline |
| Negative growth, low volatility | A slow, quiet slide | Long term perspective, stay the course |
| Negative growth, high volatility | Anxious, tempted to exit | Reassurance, diversification, talk to an advisor |
| Inside the neutral band | Nothing much to react to | Pause, hold the budget |
That last row matters as much as the others. Compute is not only about firing smarter. It is also about knowing when not to fire.
We have already seen what a simple version of this logic can do. For Franklin Templeton, Wootag Moments watched a live market index and served a growth led film when it rose 0.3% or more, a stability led film when it fell 0.3% or more, and paused the activation inside that band. The account reported an 8.3x CTR uplift and 24% of budget saved. The compute framework takes that same idea from a single threshold on a single day to multiple windows, volatility and combined conditions.
The same engine, now across weather, metals, fuel, search and more
Financial indices were the first proving ground because markets are noisy and audiences are sensitive to tone. But the engine itself does not care what the signal is. Any feed with a value and a timestamp can be computed on. So we have extended it across the signal families our customers use most.
| Signal family | What compute measures | A moment it unlocks |
|---|---|---|
| Stock indices | Growth across windows, direction, volatility | Reassurance on a choppy down week, a growth story on a steady climb |
| Weather | Change versus the last few days, deviation from the seasonal norm, streaks such as three hot days in a row | A cooling product on the first sudden heat spike, not every warm day |
| Metals | Price growth over durations, record highs, speed of a rally | Gold jewellery or savings messages when a rally is steady, value messaging when it is spiking |
| Commodities | Trend and volatility in crude, agri and other inputs | Price lock or stock up offers before a sustained rise reaches the shelf |
| Fuel prices | Week on week and month on month change, direction of revisions | Mobility, EV, lubricant or travel offers when a hike sticks, not on a one day blip |
| Search scoring | Velocity and acceleration of search interest, score against a baseline | Activating the moment a topic is genuinely surging, before the feed is full of it |
The pattern is the same in every row. A reading becomes a trend. A trend becomes a state. A state becomes the right message for the right audience.
And because compute runs on the platform, not in a spreadsheet, it keeps pace with the signal. Indicators refresh as new values arrive, and the activation still fires within the sub-300ms trigger latency the platform is built around.
Compute once, activate anywhere
The intelligence lives in the moment, not in the channel. That is the part most teams underestimate.
When the decision about what to say is made upstream, every channel downstream inherits it. The same computed state can drive a Meta or TikTok creative, a push notification from your CEP, a CTV spot, a programmatic display unit or a message on your own site and app. Each one is adapted to its format, but all of them tell the same story about the same condition at the same time.
This also means you do not need to rebuild logic per channel or per vendor. Add a new channel and it picks up the moments you already run. Swap a channel out and the logic stays. Wootag Moments sits underneath your existing stack as the signal layer, rather than replacing any part of it.
Where computed moments land, by vertical
| Vertical | Signal and compute | Example activation | Outcome to track |
|---|---|---|---|
| Fintech and wealth | Index growth over 30 days plus volatility | Reassurance creative to existing investors on a volatile down month | App opens, investment top ups, fewer redemptions |
| Banking and insurance | Gold or index trend over a quarter | Gold loan or savings plan offers on a sustained rally | Applications started, leads |
| FMCG and beverages | Temperature jump versus the 3 day average | Cold beverage or hydration push on the first sharp hot day | Store visits, quick commerce orders |
| Home and personal care | Heat or humidity streaks | Sunscreen, deodorant or laundry messaging on day three of a streak | Add to cart, sales lift |
| Mobility and auto | Fuel price change month on month | EV test drive or service offer when a hike holds | Test drive bookings, service bookings |
| Jewellery and retail | Gold price growth and record highs | Lightweight designs or exchange offers when gold spikes | Store walk ins, enquiries |
| QSR and food delivery | Weather deviation plus search velocity | Comfort food offers when rain arrives and searches surge | Orders, AOV |
| B2B and enterprise | Commodity input volatility, search scoring on a category | Thought leadership or cost certainty messaging to procurement audiences | Leads, demo bookings, site visits |
None of these require physical retail. Public signals like markets, weather and search work on their own. If you also run stores, Retail Signals can add stock and pricing so the computed moment points to a product that is actually available nearby.
A note on sources
We keep our own numbers and independent research apart, so you can weigh each for what it is.
Wootag platform and customer figures (self reported). 180+ live signal feeds, sub-300ms trigger latency and 47 live markets are platform specifications from wootag.com/moments. The Franklin Templeton results (8.3x CTR uplift, 24% budget saved) are customer reported metrics from the Wootag case studies page. The tables in this post that map computed states and verticals to messages are illustrative examples, not client results.
Independent research. McKinsey’s Next in Personalization 2021 report found that 71% of consumers expect personalized interactions and 76% get frustrated when they do not get them. The same research puts the typical revenue lift from personalization at 10 to 15%, with company results ranging from 5 to 25% depending on sector and execution. It also notes that leaders invest in AI driven decisioning so they can respond to customer signals in real time, which is the capability compute brings to real world signals.
From listening to thinking
Listening to signals got brands to the moment. Contextualizing them got the message closer to the mood. Compute is what makes the moment intelligent: it reads the trend behind the number, knows when a change is real, and holds back when it is not.
That is how relevance turns into conversions. Not by firing more often, but by firing on the right condition with the right words.
If there is a signal that matters to your category, whether it is an index, a forecast, a commodity price or a surge in search, book a demo and we will show you a computed moment built on your brand.
Signals Tell You What Happened. Compute Finds the Moments in Between
